Telemarketing call centers become to use map analytics for their clients. Leadmachine is one of the first company that presents the results of telephone campaigns to their clients using Corpis Maps map analytics.
Excel Spreadsheets Problem
Leadmachine company continuously evaluates individual campaigns for clients in Excel for basic statistics and calculations like number of potential customers interested/not interested in a product or service. This works great, but for the purposes of the final analysis of the campaign, it turned out to be insufficient (even though most call centers still work this way). Spreadsheets do not allow you to see the context in the data, which is crucial for the correct evaluation of the campaign and understanding the market. This information allows you to plan future campaigns for a client more accurately.
Example of telephone campaign evaluation in Excel.
The Benefits of Maps Analytics
Map analytics has the ability to not only display data, but also explain it (using built-in filters, statistics and various types of visualizations, including spatial aggregation). Leadmachine sends the client several screenshots from the map. They also go through the analytical map with a client and show him the combination of filters and their impact on the regional distribution of potential customers. The effect of the size or turnover of the companies on the outcome of the call is often shown. In addition, the map can be fully or partially create from a template, which significantly reduces the time required for Leadmachine to create it.
The client has the opportunity to get an analytical map and follow up with the targeted activity of their sales and marketing team.
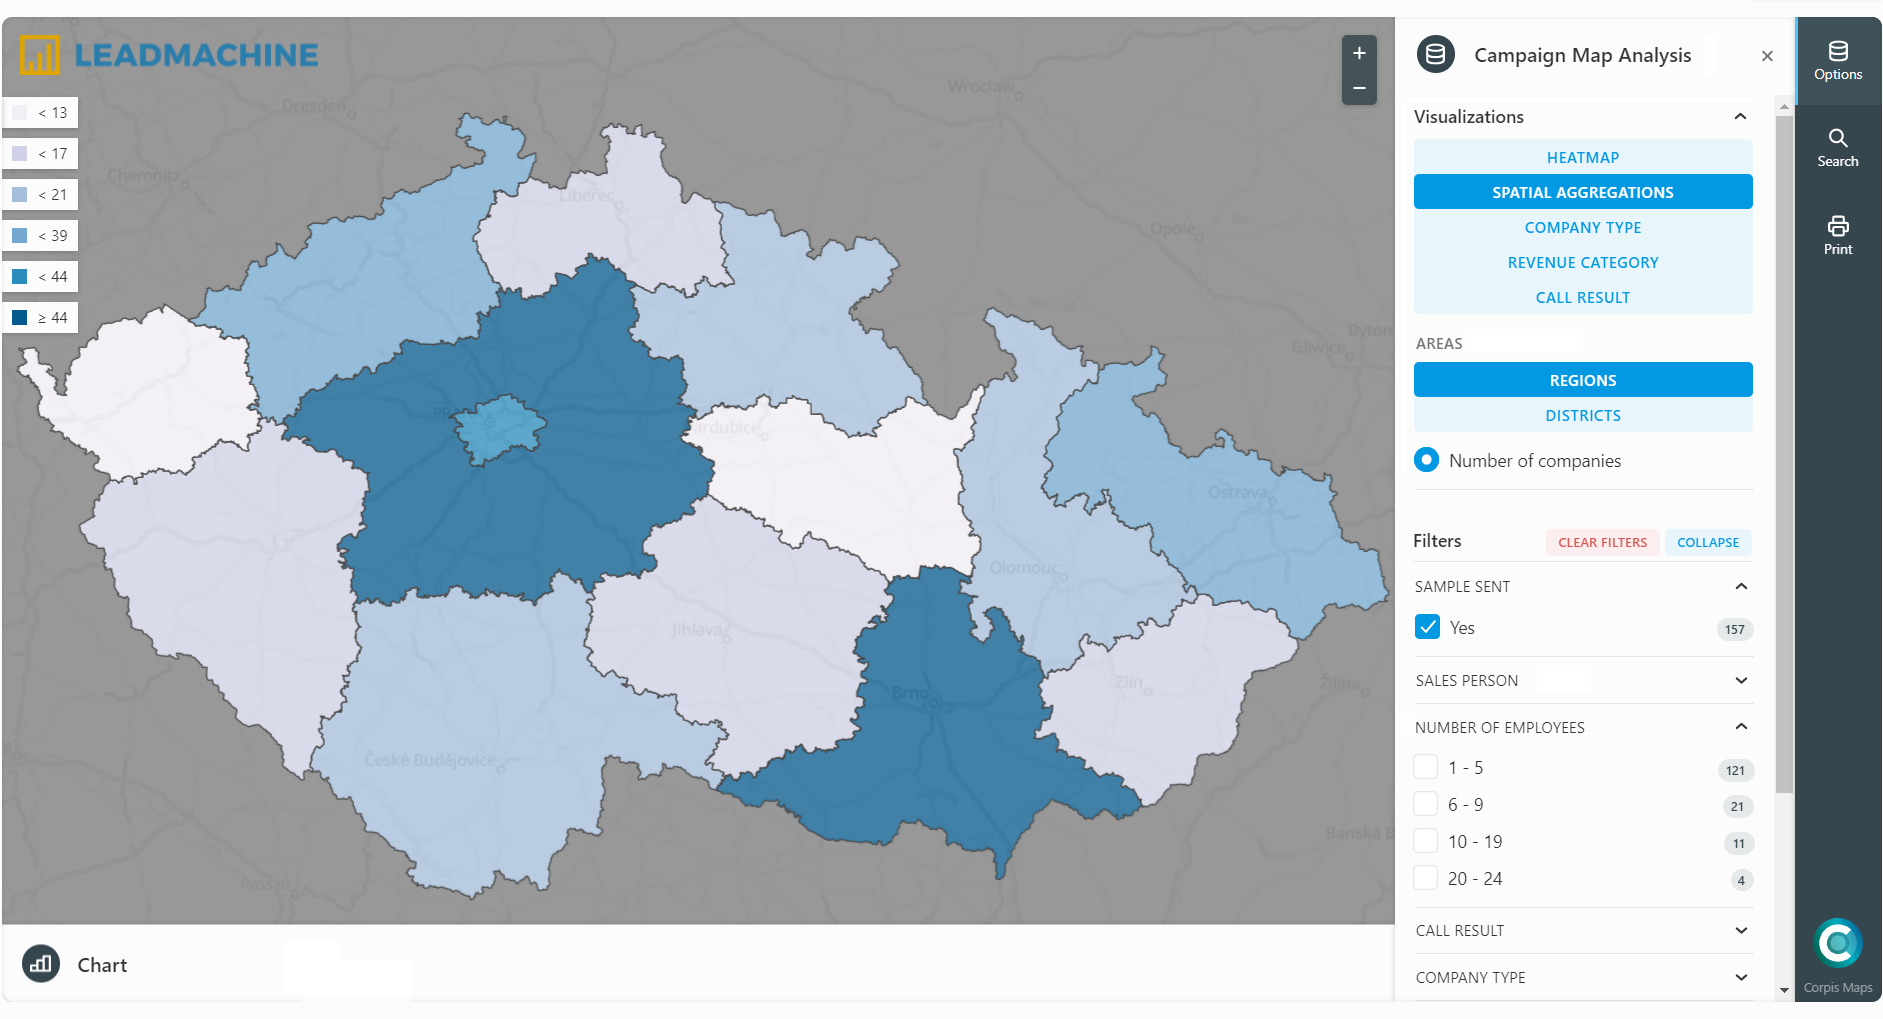
The map clearly shows to which regions the most samples were sent (based on the telephone campaign) and at the same time statistics on how many employees these companies have. The category of 1-5 employees predominates (121x).
Petr Chaloupka – CEO Leadmachine
“Our campaign analysis is actually an analysis of a campain and also the market. Information such as company turnover, number of employees, etc. is difficult to combine in PivotTables in Excel. In Corpis Maps, this can be done by simply checking selected parameters. And most importantly – you can easily display everything on the map as points, heatmap and also as aggregations in the districts, regions and client’s sales regions”.
Are you interested in Corpis Maps map analytics? Contact us.