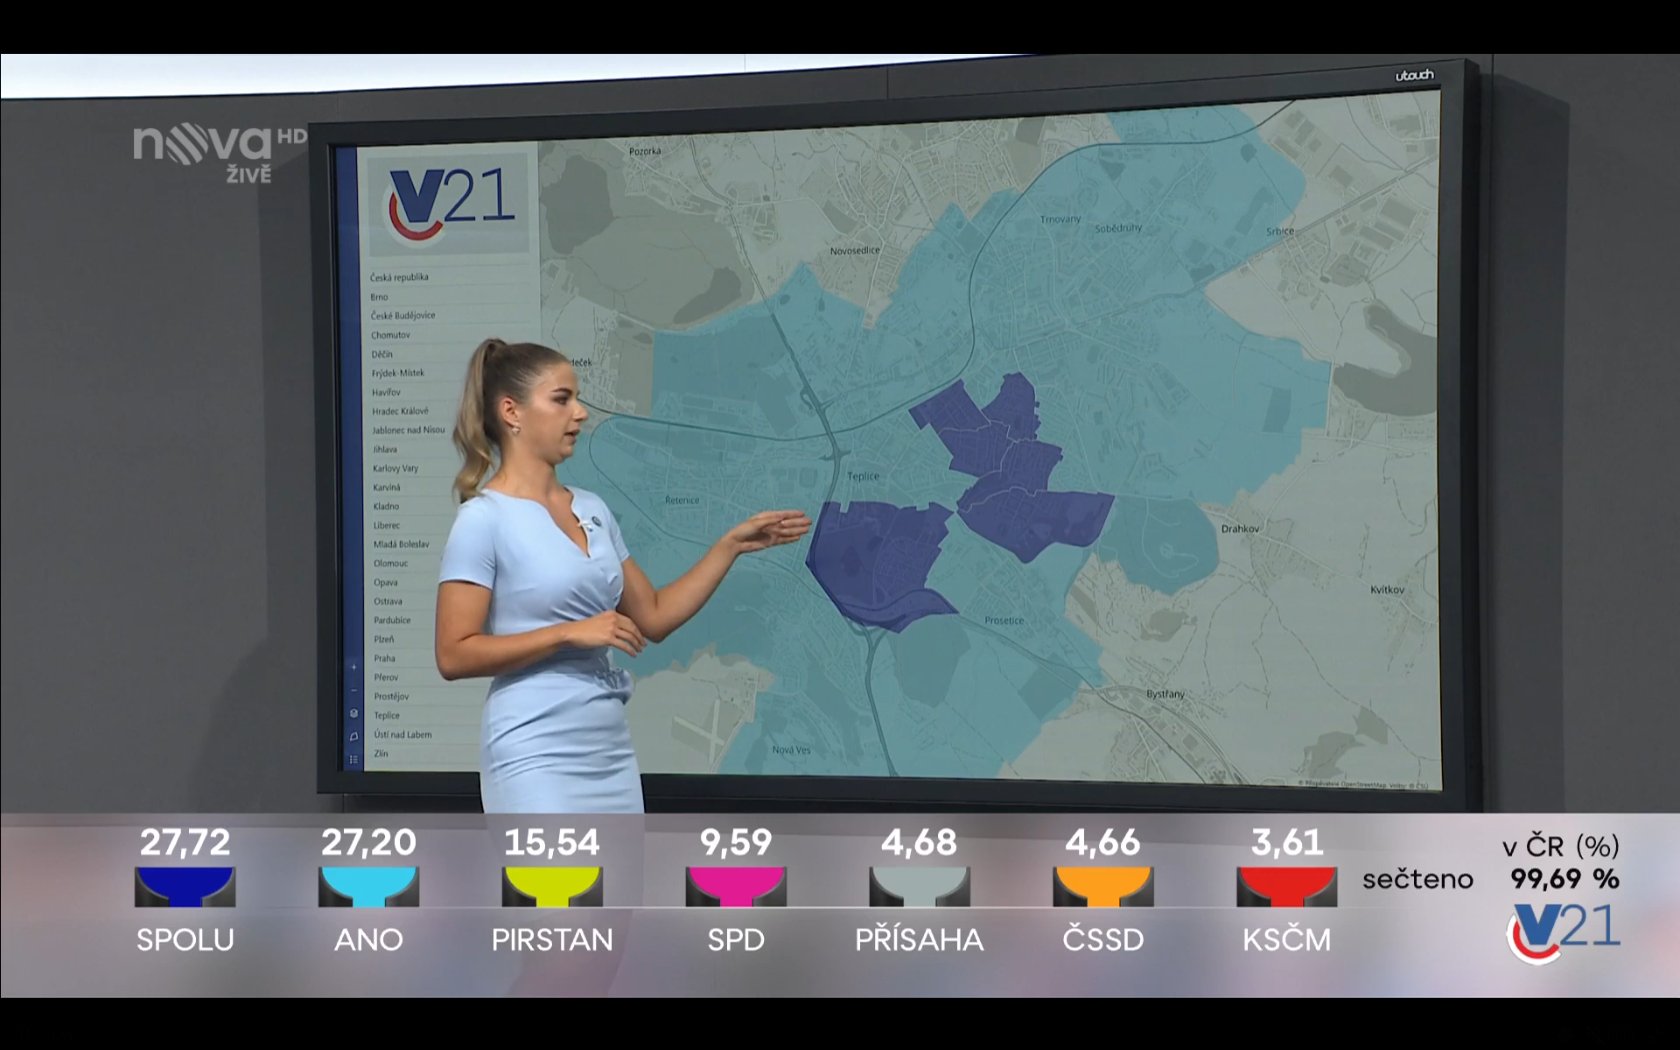
This year’s elections to the Chamber of Deputies attracted a lot of attention not only in the polling stations, but also on television screens. If you chose the TV Nova election studio, you certainly did not miss the fact that all the results were presented to the nation in an interactive analytical map. In the map from T-MAPS / Corpis Maps, which was the only one that allowed a view down to the detail of the constituencies!
We are glad that our map analyst helped TV Nova and its viewers with an orientation in election data, which would otherwise be very difficult to read.
Corpis Maps map analytics is primarily intended for medium and large companies, where it improves business by evaluating business data and potential. Try it too.
Interested in Corpis Maps analytics maps?
Contact us and try Corpis Maps for free.